
Customer
The customer is a leading Austrian-based provider of integrated hardware and software solutions in the automotive industry, boasts a global presence with 10,000+ employees and operations in 40+ countries.
Challenges
The customer required an advanced graph control for the emission measurement system's new release, demanding high performance and specific functions for data analysis and visualization. Key requirements included accommodating up to 20 simultaneous views, handling 960 channels, maintaining an update rate of 5+ Hz, and CPU usage below 5%.
Solution
To expedite development, our team leveraged existing implementations with basic graph plotting capabilities. Market analysis revealed that off-the-shelf products fell short of the required efficiency, leading us to base iTrend on a low-level open-source library. The proof-of-concept version underwent rigorous automated load tests, ensuring optimal performance characteristics throughout development.
Enhanced Usability: iTrend's flexible settings enable operators to group channels, adjust time intervals, and customize GUI elements to meet individual needs. Collaboration with customer experts facilitated the implementation of product-oriented analytics, binding measured values and statistical calculations to specific test phases.
Core functionality of iTrend:
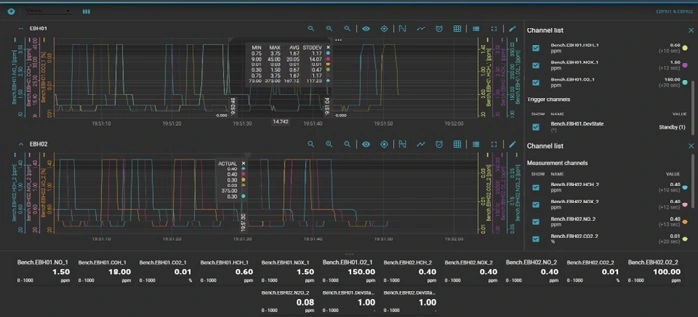
• Real-time visualization of measurement data and ongoing test phases;
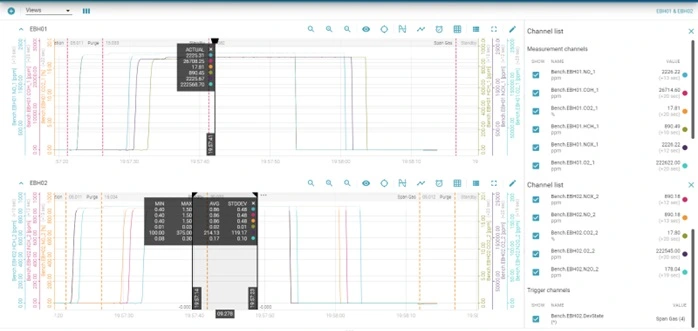
• Configuration and monitoring of statistical parameters calculated from measured readings;
• Visualization and analysis of historical data, allowing for result comparison across various tests.
Technological advancements: Built on HTML5 technology, iTrend seamlessly integrates into higher-level software products and operates as a standalone tool in browsers across multiple operating systems.
Results
iTrend has been successfully integrated into the customer's product, providing a balance of high performance, efficient data handling, and a user-friendly interface. Positive feedback led to its inclusion as part of the standard controlset for use with other software products in the customer's portfolio.